OpenML stands for Open Machine Learning and is an online platform, which aims at supporting collaborative machine learning online. It is an Open Science project that allows its users to share data, code and machine learning experiments.
At the time of writing this blog post I am in Eindhoven at an OpenML workshop, where developers and scientists meet to work on improving the project. Some of these people are R users and they (we) are developing an R package that communicates with the OpenML platform.

OpenML in R
The OpenML R package can list and download data sets and machine learning tasks (prediction challenges). In R one can run algorithms on the these data sets/tasks and then upload the results to OpenML. After successful uploading, the website shows how well the algorithm performs. To run the algorithm on a given task the OpenML R package builds on the mlr package. mlr understands what a task is and can run learners on that task. So all the OpenML package needs to do is convert the OpenML objects to objects mlr understands and then mlr deals with the learning.
A small case study
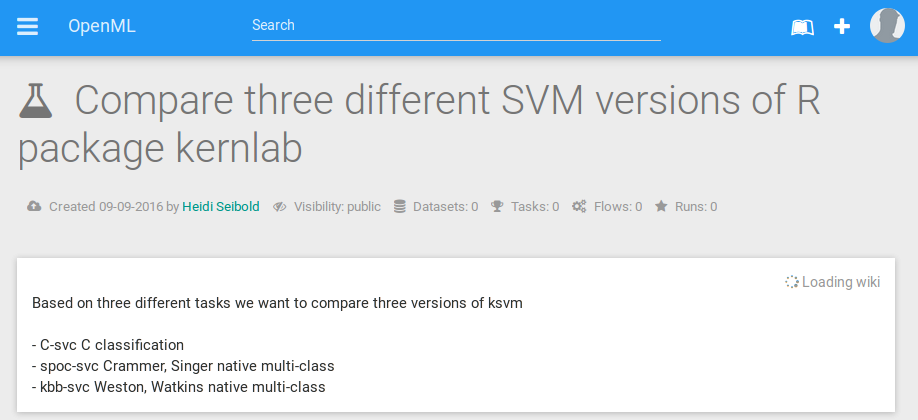
We want to create a little study on the OpenML website, in which we compare different types of Support Vector Machines. The study gets an ID assigned to it, which in our case is 27. We use the function ksvm (with different settings of the function argument type) from package kernlab, which is integrated in mlr (“classif.ksvm”).

For details on installing and setting up the OpenML R package please see the guide on GitHub.
Let’s start conducting the study:
- Load the packages and list all tasks which have between 100 and 500 observations.
library("OpenML") library("mlr") library("farff") library("BBmisc")

dsize = c(100, 500) taskinfo_all = listOMLTasks(number.of.instances = dsize)- Select all supervised classification tasks that do 10-fold cross-validation and choose only one task per data set. To keep the study simple and fast to compute, select only the first three tasks.
taskinfo_10cv = subset(taskinfo_all,
     task.type == "Supervised Classification" &
     estimation.procedure == "10-fold Crossvalidation" &
     evaluation.measures == "predictive_accuracy" &
     number.of.missing.values == 0 &
     number.of.classes %in% c(2, 4))

taskinfo = taskinfo_10cv[1:3, ]- Create the learners we want to compare.
lrn.list = list(
   makeLearner("classif.ksvm", type = "C-svc"),
   makeLearner("classif.ksvm", type = "kbb-svc"),
   makeLearner("classif.ksvm", type = "spoc-svc")
)- Run the learners on the three tasks.
grid = expand.grid(task.id = taskinfo$task.id,
                   lrn.ind = seq_along(lrn.list))

runs = lapply(seq_row(grid), function(i) {
  message(i)
  task = getOMLTask(grid$task.id[i])
  ind = grid$lrn.ind[i]
  runTaskMlr(task, lrn.list[[ind]])
})- And finally upload the runs to OpenML. The upload function (uploadOMLRun) returns the ID of the uploaded run object. When uploading runs that are part of a certain study, tag it with study_ and the study ID. After uploading the runs appear on the website and can be found using the tag or via the study homepage.
## please do not spam the OpenML server by uploading these
## tasks. I already did that.
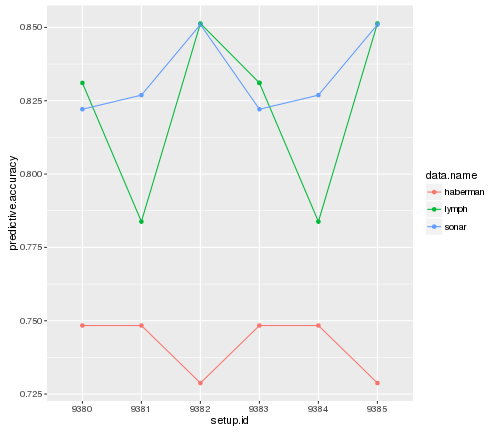
run.id = lapply(runs, uploadOMLRun, tags = "study_27")- To show the results of our study, list the run evaluations and make a nice plot.
evals = listOMLRunEvaluations(tag = "study_27")

evals$task.id = as.factor(evals$task.id)
evals$setup.id = as.factor(evals$setup.id)

library("ggplot2")
ggplot(evals, aes(x = setup.id, y = predictive.accuracy,
                  color = data.name, group = task.id)) +
  geom_point() + geom_line()
Now you can go ahead and create a bigger study using the techniques you have learned.
Further infos
If you are interested in more, check out the OpenML blog, the paper and the GitHub repos.
Originally published at mlr-org.github.io.