import numpy as np
import matplotlib.pyplot as pltExample of jupyter notebook for Quarto
1) Import packages
2) Plotting
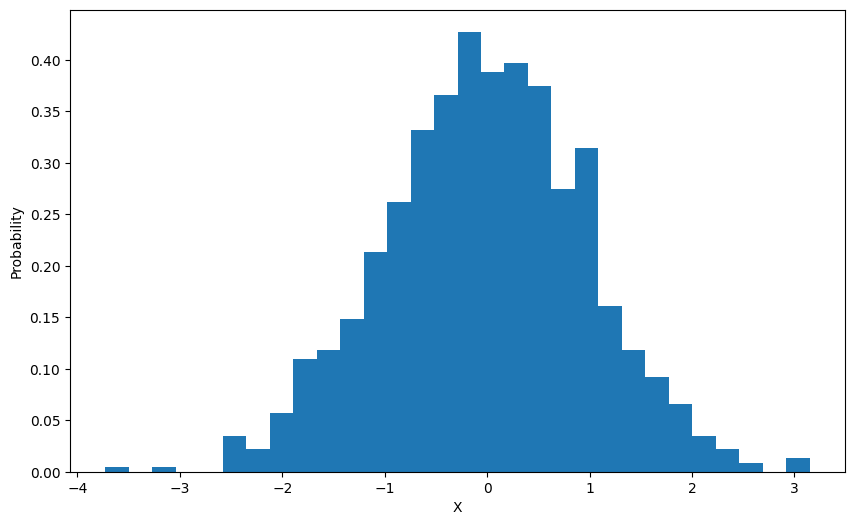
We plot below (Figure 1) the histogram of 1000 samples from a normal distribution.
x = np.random.normal(size=1000)
plt.figure(figsize=(10, 6))
plt.hist(x, density=True, bins=30)
plt.ylabel('Probability')
plt.xlabel('X')
plt.show()